This post is part of a tutorial for deploying a basic website with monitoring and analytics without using Docker or containers. The introductory post gives an overview of the tutorial.
In the previous post, we covered how to configure SSL with Nginx and our site. With that post, general configuration of the site is complete. The remainder of the posts in this tutorial focus on logging and analytics. Specifically server-side logging and error logging. Even if your website is designed to just be a small hobby site it is extremely useful to have the ability to look at access logs and error logs.
Viewing Nginx logs
First, we'll focus on viewing server-side access logs. On our Droplet, Nginx is actually already creating these at a default location for us. On the Droplet, if you open up the /etc/nginx/nginx.conf you should see something around line 38 like this:
##
# Logging Settings
##

access_log /var/log/nginx/access.log;
error_log /var/log/nginx/error.log;
Open up the access.log file:
sudo nano /var/log/nginx/access.log
You should see timestamps and details of requests made. To view the default configuration I recommend checking out the ngx http log_module docs. By default the combined log format is used (you can see this in the module docs linked above). You can also create your own custom format if desired, but for this tutorial we'll stick with the default configuration.
The error.log won't get much use in our simple single-page application for our tutorial, but errors encountered on the server will be logged here. It's worth noting there are several severity levels and a default is used so at least some information is gathered by default.
Looking at these logs individually can be useful, but it's also very granular. In many cases, being able to group and organize this information will give us valuable insight into how our site and web server are being used. GoAccess can provide this type of view with minimal overhead. In fact, we can get a very clean view of this data right in the console.
Using GoAccess
GoAccess is an open-source log analyzer and viewer. We'll focus on two features for now:
- Analyzing logs in the terminal
- Creating real-time HTML report of logs to view in a browser
First, we need to pull down GoAccess to our Droplet. According to the GoAccess docs since we're using Ubuntu we can run:
sudo apt-get install goaccess
Now, let's try to get a real-time view of our logs in the terminal:
sudo goaccess /var/log/nginx/access.log -c --log-format=COMBINED
You should see something like this appear in the terminal:
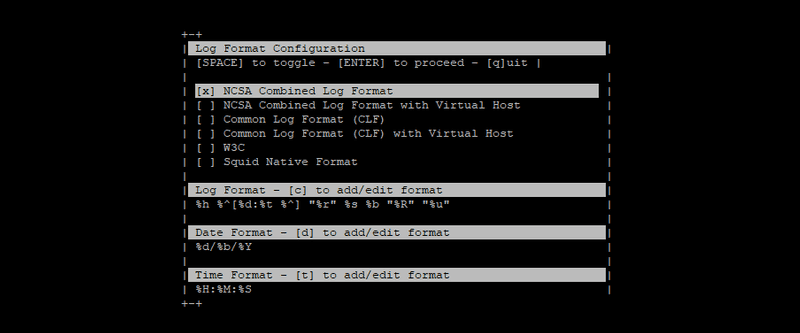
You can see goaccess has populated a Log, Date and Time format since we specified the COMBINED log format as a command argument. You can hit ENTER to proceed and should now see a terminal dashboard with lots of great information.
Note the Log Source at the top. This is the file we're currently viewing. Based on our Nginx config, this is the active log file. You can load past log files by simply specifying the old log file you want to see on the command line when using goaccess.
Also at the top of the terminal you can see info like Total Requests, Bandwidth, Unique Visitors, etc. If you try hitting the site in your local browser again you should see some of these values change. Scrolling down in the terminal you can see a wealth of detail such as Request Files in order of most popular, 404s, Geo Location and Browser as well as other information. It's wonderful that goaccess offers all this as baked-in functionality that requires such a small amount of setup.
If you would rather have this info rendered in a web browser, goaccess can generate an HTML report of the same data we just saw in the terminal. This can be handy for having a web page that's easily accessible outside of a terminal session. goaccess can generate a real-time report in HTML as well, but since we're using SSL on our site the setup is more involved that I believe is in the scope of this tutorial. If you want to configure that I recommend reading the following:
- GoAccess Getting Started page - Check out the 'Real-Time HTML Output' section
- GoAccess HTML Report FAQ - Shows more detail on how to configure this with SSL support
- This GoAccess GitHub issue - Has additional info on setting up SSL support
- Restricting Access with HTTP Basic Authentication on Nginx - If you decide to make this accessible remotely it should probably not be available to everyone.
I find that using the terminal support is enough for my purposes, but it's great that this HTML output is available as an option. As a way to see this we can generate a snapshot of the current log file as an HTML page with the following command:
sudo goaccess access.log -o report.html --log-format=COMBINED
This will print out a report of the current contents of the access.log file. This file can then be transferred over to our local machine using your favorite SFTP tool and opened up to see the data in the browser.
NOTE: Be sure to delete this report html file from your Droplet when done with it just to keep things tidy.
goaccess is a super accessible way to analyze logs from our website. There a multitude of other features goaccess has that we didn't touch! To find out more about it check out the GoAccess Features page. (I'm in no way affiliated with the tool)
Great! We now have the ability to easily analyze basic server logs.
Securely handling your logs
NOTE: Our server logs will be rotated (archived) with the configured rotate value in /etc/logrotate.d/nginx. You can change this to your desired value if necessary. This default log rotation configuration will not automatically clean up your logs until 14 days have been logged. This is set with the rotate 14 line in the etc/logrotate.d/nginx file. With this setting, the oldest log file will be removed to create room for the newest one after 14 have been created (that matching our file name scheme of 'access.log.[number]'
You should monitor these logs for your website and make sure no sensitive information is exposed. GDPR has brought some changes to the types of data, how it's stored and processed that are worth reading about. I will leave these as an exercise for the reader as I am not a lawyer and the site you are deploying may have unique requirements.
You may have thought we would be working with Google Analytics or other client-side analytics tools like Fathom or Matomo. There are definitely great uses for client-side analytics. This tutorial focuses on the basics and I believe basic stats include metrics such as top requests, geo location, browser usage, server response errors and the ability to view access logs for potential malicious behavior. All of this data can be acquired via server logs. You can, of course, supplement these types of logs on the server-side as well as the client-side.
In part 6 of the tutorial we will see how to add automated error logging to our website with Sentry. Hope to see you there!